Consultation
 Open an account

Foreign trade in January-May 2026
In May 2026, Kazakhstan's foreign trade resulted in a surplus: goods exports increased by 5.8% m/m after a decline in April, while imports decreased by 13.5% m/m. Over the period from January to May 2026, export growth rates (+1.6% y/y) remained below import growth rates (+7.7% y/y), reflecting a more moderate dynamics of export earnings from raw materials. Over the five months, the trade surplus amounted to $4.4 billion, compared to $5.8 billion a year earlier. In the regional structure of foreign trade, the share of Asian and CIS countries increased, while the share of European countries slightly declined.
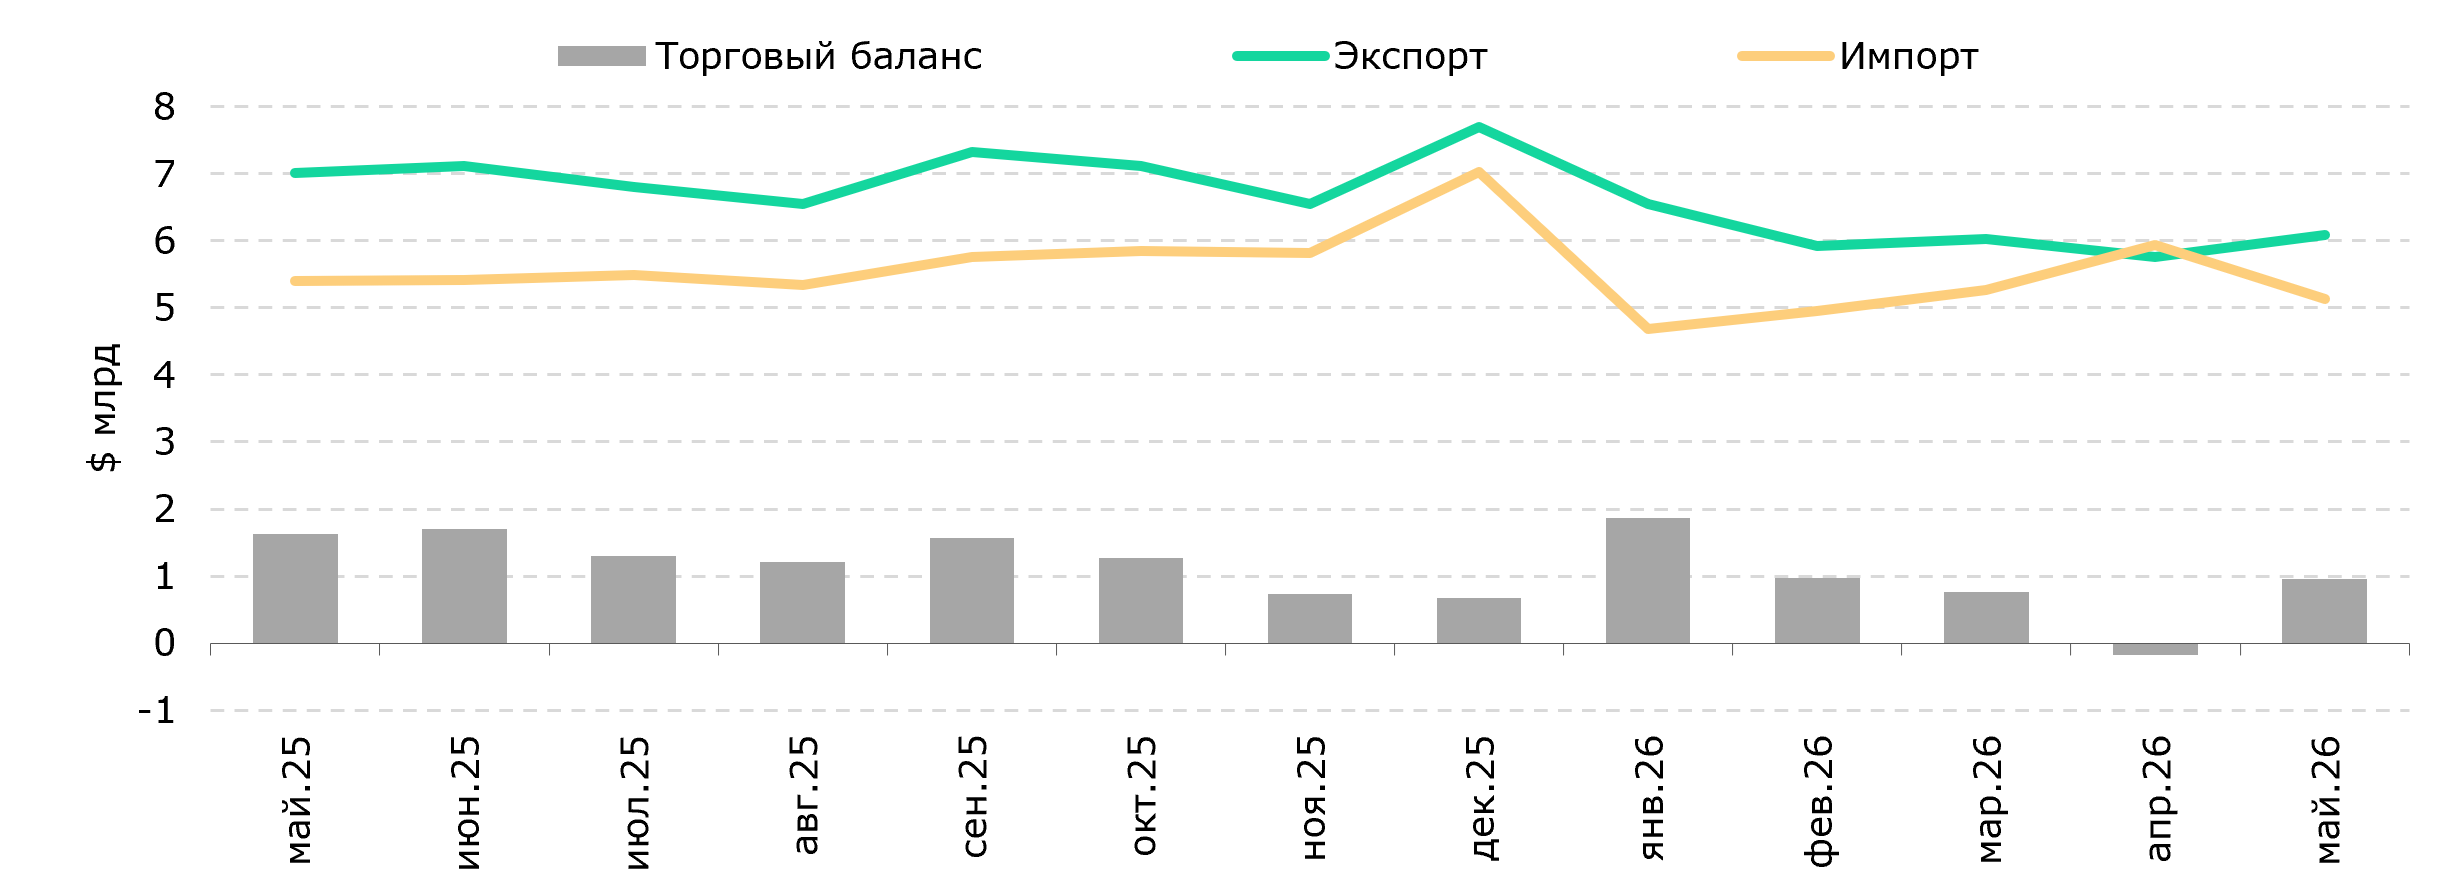
According to data from the Bureau of National Statistics of the Republic of Kazakhstan, in May 2026 exports amounted to $6.1 billion, increasing by 5.8% m/m, while the annual indicator decreased by 13.2%. Imports fell by 13.5% m/m and by 4.9% y/y to $5.1 billion. As a result, the trade balance shifted from a deficit in April to a surplus of $1 billion.
For January-May 2026, the foreign trade turnover reached $56.3 billion (+4.3% y/y), exports - $30.4 billion (+1.6% y/y), imports - $26 billion (+7.7% y/y). The trade balance surplus for 5M2026 amounted to $4.4 billion (-23.9% y/y) (Fig. 1).
Fig. 1. Dynamics of foreign trade
Source: BNS
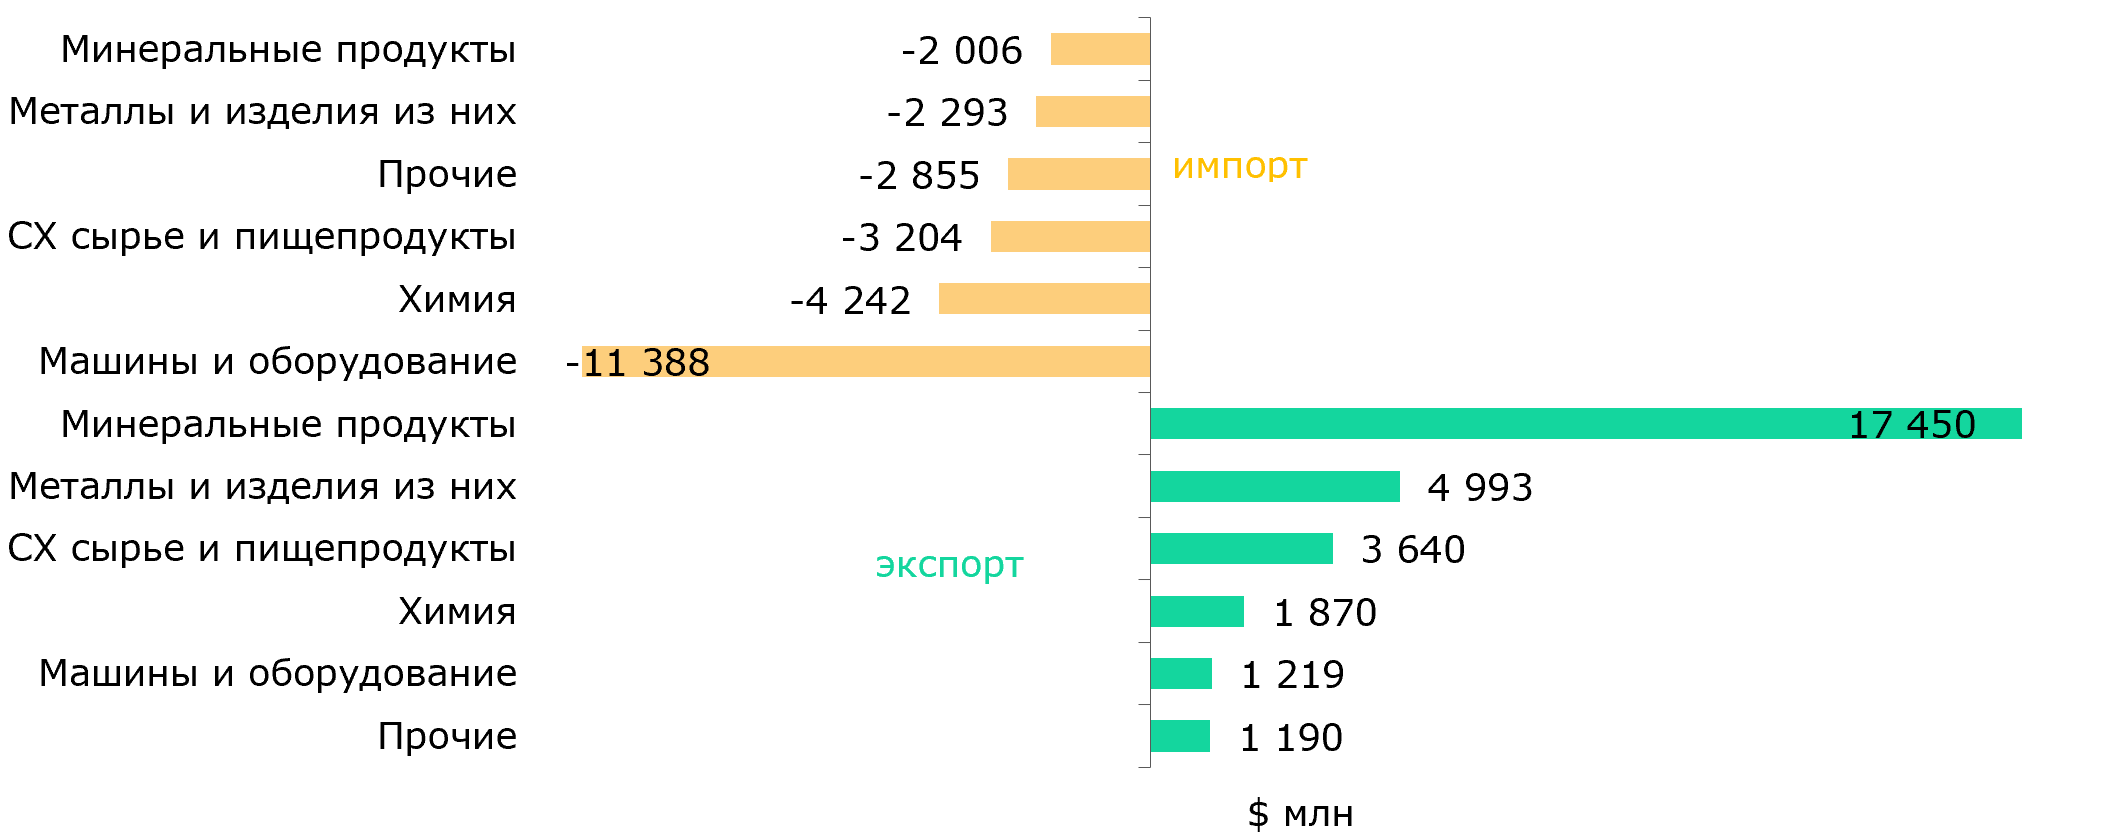
The commodity structure for January–May 2026 shows that export dynamics were largely driven by raw material sector indicators. Exports of mineral products decreased by 8% y/y to $17.4 billion, fuel and energy products by 15.7% y/y to $14.3 billion. With mineral products accounting for 57.5% of total exports, the dynamics of oil and gas sector export revenue continued to have a significant impact on overall export performance.
A positive contribution to export dynamics came from increased shipments of animal and plant products and processed foodstuffs (+35.6% y/y to $3.6 billion), metals and articles thereof (+22.6% y/y to $5 billion), and other goods (+53.1% y/y to $1.2 billion). Exports of chemical industry products remained at the previous year's level ($1.9 billion), while exports of machinery, equipment, vehicles, instruments, and apparatuses fell by 18.4% y/y to $1.2 billion. As a result, total goods exports grew by 1.6% y/y.
As of January–May 2026, imports maintained positive annual dynamics, though in monthly terms import volumes in May decreased compared to April. For January–May 2026, imports of machinery, equipment, vehicles, instruments, and apparatuses amounted to $11.4 billion (+9.1% y/y), accounting for 43.8% of total imports. Supplies of mineral products increased (+51.7% y/y to $2 billion), including fuel and energy products (+56% y/y to $1.5 billion), chemical products (+5.4% y/y to $4.2 billion), and agricultural products and foodstuffs (+8.5% y/y to $3.2 billion) (Fig. 2). At the same time, imports of textiles, footwear, and construction materials declined.
Fig. 2. Exports and imports by commodity groups, January–May 2026, $ million
Source: BNS
In January–May, Kazakhstan's foreign trade structure continued to see an increasing share of Asian countries. Trade turnover with Asian countries grew by 14.8% y/y to $20.6 billion, and their share increased to 36.6% from 33.3% a year earlier. Exports to Asian countries rose by 29% y/y to $10.3 billion. The highest export growth rates were recorded in trade with China (+15.5% y/y, 19.9% export share), Turkey (+74.5% y/y, 7.6% share), and Uzbekistan (+39.4% y/y, 5.8% share). Goods shipments to Europe fell by 13.4% y/y, including to Italy by 27.3% y/y. Exports to Russia decreased by 11.9% y/y.
In imports, Russia led ($8.2 billion, 31.6% share, +19.1% y/y) and China ($7.5 billion, 28.8%, +11.5% y/y). Germany (4.9%), the USA (4.4%), the Republic of Korea (2.5%), and Turkey (2.2%) followed. Imports from CIS countries grew by 19.7% y/y to $9.8 billion, while imports from European countries fell by 5.6% y/y.
The formation of a trade surplus in May was mainly due to a decrease in import volumes compared to April amid moderate export recovery. Given the high share of mineral products, the dynamics of fuel and energy exports continue to largely determine the overall dynamics of foreign trade. The import structure maintains a high share of machinery and equipment, chemical products, and energy carriers. In the regional structure of foreign trade, the largest shares of trade turnover were with Asian countries (36.6%), Europe (30.9%), and CIS countries (28.2%).
Kurmankbekov Asan – Analytical Center
When using material from this publication, a reference to the original source is mandatory.