Consultation
 Open an account

The transport sector in January-July 2026
The transport sector in January-July 2026 maintained positive dynamics: the index of physical volume of services grew by 7.4% y/y (+22.5% y/y over seven months of 2025).
Positive dynamics were driven by growth in all key industry indicators: freight and passenger traffic, freight turnover, and passenger turnover. An increase in freight turnover and freight volumes was recorded in the sea, inland waterway, and road transport segments. Volumes of rail freight and passenger traffic showed an adjustment while maintaining positive dynamics in freight and passenger turnover. The dynamics of freight transportation by pipeline transport were shaped against the backdrop of changes in oil production volumes.
The "Transport and Storage" sector in January-July 2026 maintained positive dynamics: the index of physical volume of services grew by 7.4% y/y (+22.5% y/y for 7M2025) (Fig. 1). Freight transportation increased by 0.9% y/y, and freight turnover grew by 1.0% y/y. 1,130.1 million passengers were transported, which is 4.5% more than last year. Passenger turnover increased by 6.1% y/y.
Fig. 1. Dynamics of the "Transport and Storage" sector, % y/y 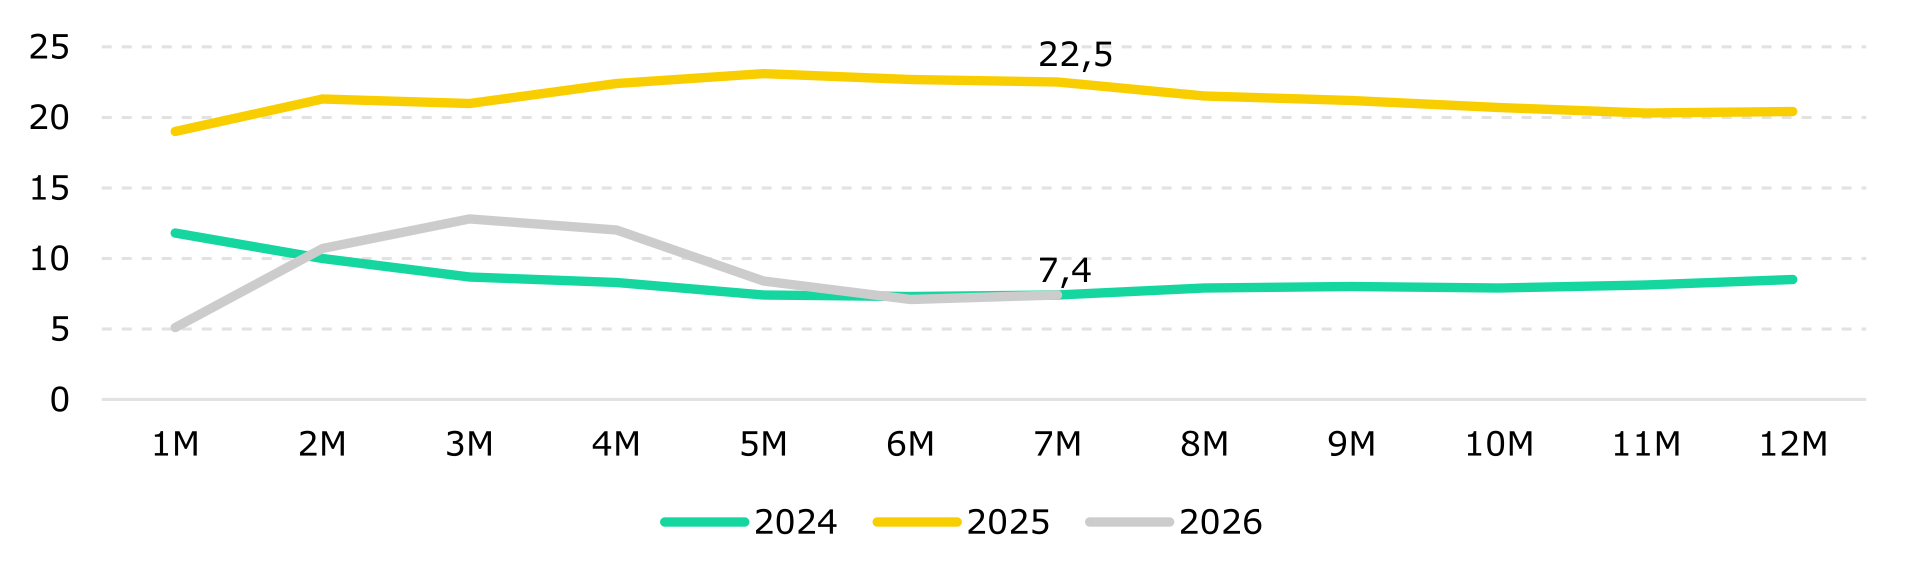
Source: BNS
Rail transport carried 190.1 million tonnes of freight (35.2% of the total freight volume in the transport sector), which is 1.7% less than last year. Freight turnover grew by 2.5% y/y to 170.1 billion t-km, accounting for 57% of the total sector’s freight turnover (Fig. 2).
In the road transport sector, freight transportation increased by 6.2% y/y (37% of the total volume). Freight turnover grew by 6.5% y/y.
Pipeline transport saw a decline: over seven months, 148.5 million tonnes of freight were transported, which is 2.6% less than last year (compared to -2.0% y/y as of 6M2026). Freight turnover decreased by 2.9% y/y (compared to -2.4% y/y as of the first half of the year).
In sea transport, freight transportation increased by 7.2% y/y, and freight turnover grew by 18.0% y/y. In inland waterway transport, freight transportation rose by 68.5% y/y, and freight turnover more than doubled (+109.6% y/y).
Air freight transportation continued to show negative dynamics: volumes declined by 8.1% y/y, and freight turnover by 3.9% y/y.
In the passenger segment, rail transport carried 11.1 million passengers, which is 3.5% less than last year. Passenger turnover grew by 0.1% y/y to 9.3 billion p-km. The decline in passenger traffic was less pronounced compared to the same period in 2025 (-6.3% y/y).
In road passenger transportation, growth reached 4.6% y/y (+11.0% y/y for 7M2025). 1,109.6 million passengers were transported, and passenger turnover increased by 6.8% y/y (5.1% y/y as of the first half of the year). In the taxi segment, passenger transportation grew by 3.2% y/y against a high base of the previous year.
In sea transport, passenger transportation increased by 138.3% y/y. In inland waterway transport, passenger traffic grew by 7.0% y/y.
In air passenger transportation, growth accelerated to 2.8% y/y (2.6% y/y as of the first half of the year). Over seven months, 9.2 million passengers were transported, and passenger turnover increased by 8.1% y/y.
Fig. 2. Transport activity, % y/y
| Freight transportation | Passenger transportation | |||
| 7M2025 | 7M2026 | 7M2025 | 7M2026 | |
| Total | 10.1 | 0.9 | 10.7 | 4.5 |
| Rail | 11.9 | -1.7 | -6.3 | -3.5 |
| Road | 1.2 | 6.2 | 11.0 | 4.6 |
| including taxis | - | - | 116.0 | 3.2 |
| Pipeline | 17.3 | -2.6 | - | - |
| Sea | 37.1 | 7.2 | -54.6 | 138.3 |
| Inland waterway | -58.4 | 68.5 | 13.6 | 7.0 |
| Air | 9.6 | -8.1 | 7.3 | 2.8 |
Source: BNS
Transport sector activity in January-July 2026 was characterized by more moderate growth rates in key indicators and heterogeneous dynamics across different transport modes. Main transport activity indicators maintained positive dynamics: freight transportation increased by 0.9% y/y, freight turnover by 1.0% y/y, passenger transportation by 4.5% y/y, and passenger turnover by 6.1% y/y.
Positive dynamics were maintained in road freight transportation, sea, and inland waterway transport. In the rail segment, freight volumes declined, while freight turnover increased, which may indicate an increase in the average distance of transportation.
Pipeline transport experienced negative dynamics, which may be linked to a reduction in oil production in the country (-8.9% y/y in 7M2026) and logistical constraints on key export routes.
In the passenger segment, positive dynamics were observed in road, air, sea, and inland waterway transport. In the taxi sector, the growth rate of passenger transportation slowed, which may be due to a high base of comparison following the expansion of statistical coverage in 2025.
Saltanat Igenbekova - Analytical Center
When using material from this publication, a reference to the primary source is mandatory.