Decrease in long-term rates
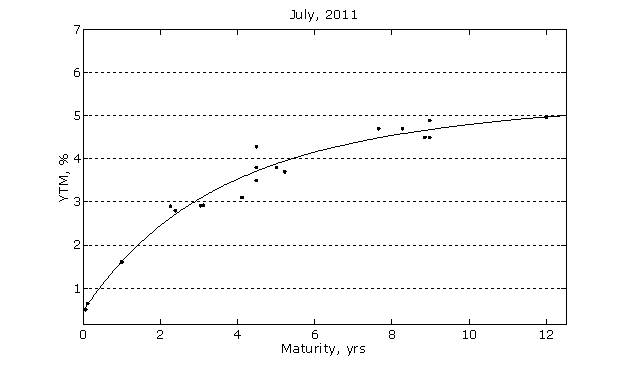
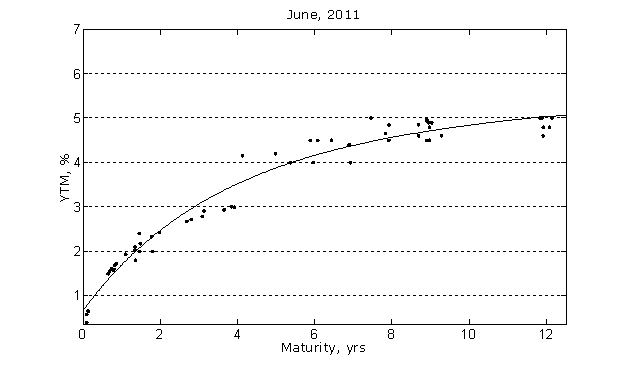
In July, the long-term rates continued to decrease, but the rates decreased at a slower pace in the first half of 2011. In 2011 the variability of data around the yield curve significantly dropped, reaching its historic minimum of 15 b.p. in the past month.
Methodology
Our methodology is based on a standard Nelsen-Siegel specification and uses a formalized procedure to exclude certain observations that we believe did not contribute to price discovery. We chose a Nelsen-Siegel specification because it is reasonably flexible and is used widely around the world.
The curve that is presented in this note is a yield curve, that is, it approximates yield to maturity as a function of time to maturity. All observations carry equal weight. Each curve presented here covers a period of one calendar month, beginning from January 2006.
The choice of monthly frequency represents a compromise between considerations of timeliness and precision. Given the scarcity of observations, we felt that one month was the shortest period that contained enough data for the methodology chosen.
The number of observations for the sample period varies from 47 in January 2008 to 406 in April 2009. The observations include all permanent sales of certain types of government debt securities, both initial placement and secondary market transactions, all of which were intermediated and registered by KASE. The securities included the discount notes of the National Bank and discount and fixed-coupon bonds of the Ministry of Finance, denoted by MEKKAM, MEOKAM and MEUKAM. We did not include indexed bonds.
We excluded the observations which in our view did not aid price discovery. This, on average, reduced the sample by between 2.6% and 7%, depending on the year.
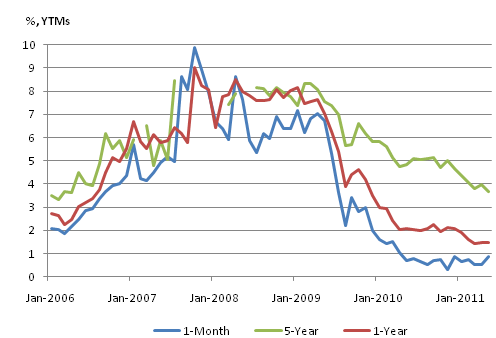
Figure 1. Risk-free interest rates for one-month, one-year and five-year maturities.

Источник: KASE, IRBIS, расчеты Halyk Finance.
Примечание: Разрывы на графике 5-летних ставок соответствуют периодам, в которых не было сделок по инструментам со сроком погашения 5 и более лет.
Мы также приводим среднеквадратичную ошибку регрессии по каждому месяцу. В некоторые месяцы изменчивость данных вокруг кривой была высокой (среднеквадратичная ошибка 209 базисных пунктов в апреле 2008 года), а иногда – низкой (к примеру, 15 базисных пунктов в июле 2011).
Рис. 2. Кривые доходности и сделки с ГЦБ.


